Supply Chain Analytics That Show Where the Margin Goes
Supply Chain Analytics That Show Where the Margin Goes.
Data insights and analysis for transport and logistics means taking the job, vehicle, telematics and freight data you already capture and turning it into a single, trusted read on cost and performance. That is the easy part to describe. The work that decides whether you believe the numbers is the unglamorous bit. Reconciling a job in your TMS with a GPS trail and a depot scan when none of them share an ID. Documenting where carrier files arrive late or with gaps. Pinning down what cost-to-serve actually includes before anyone quotes a figure. We do that groundwork first, so the lane-profitability number on the screen holds up when a dispatcher questions it.
Book a discovery callWhere analysis pays off across a freight network
True cost-to-serve by lane and customer
Working out what each lane and account really costs once fuel, detention, empty running and failed deliveries are counted, so pricing and account decisions rest on margin rather than headline revenue.
On-time performance you can trace to a cause
Pinpointing where and why delivery windows slip, by depot, lane, time of day and customer site, so a service fix targets the real failure point instead of the account that shouts loudest.
Fleet and trailer utilisation
Reading telematics and job records together to show where capacity is lost to idle time, empty running and weak backhaul matching, then quantifying what closing each gap is worth.
Demand and capacity modelling by lane
Modelling volume by lane and season so depot, vehicle and labour planning sit on the actual demand trajectory, not last peak plus a guess, with the assumptions written down.
Where transport operators get stuck
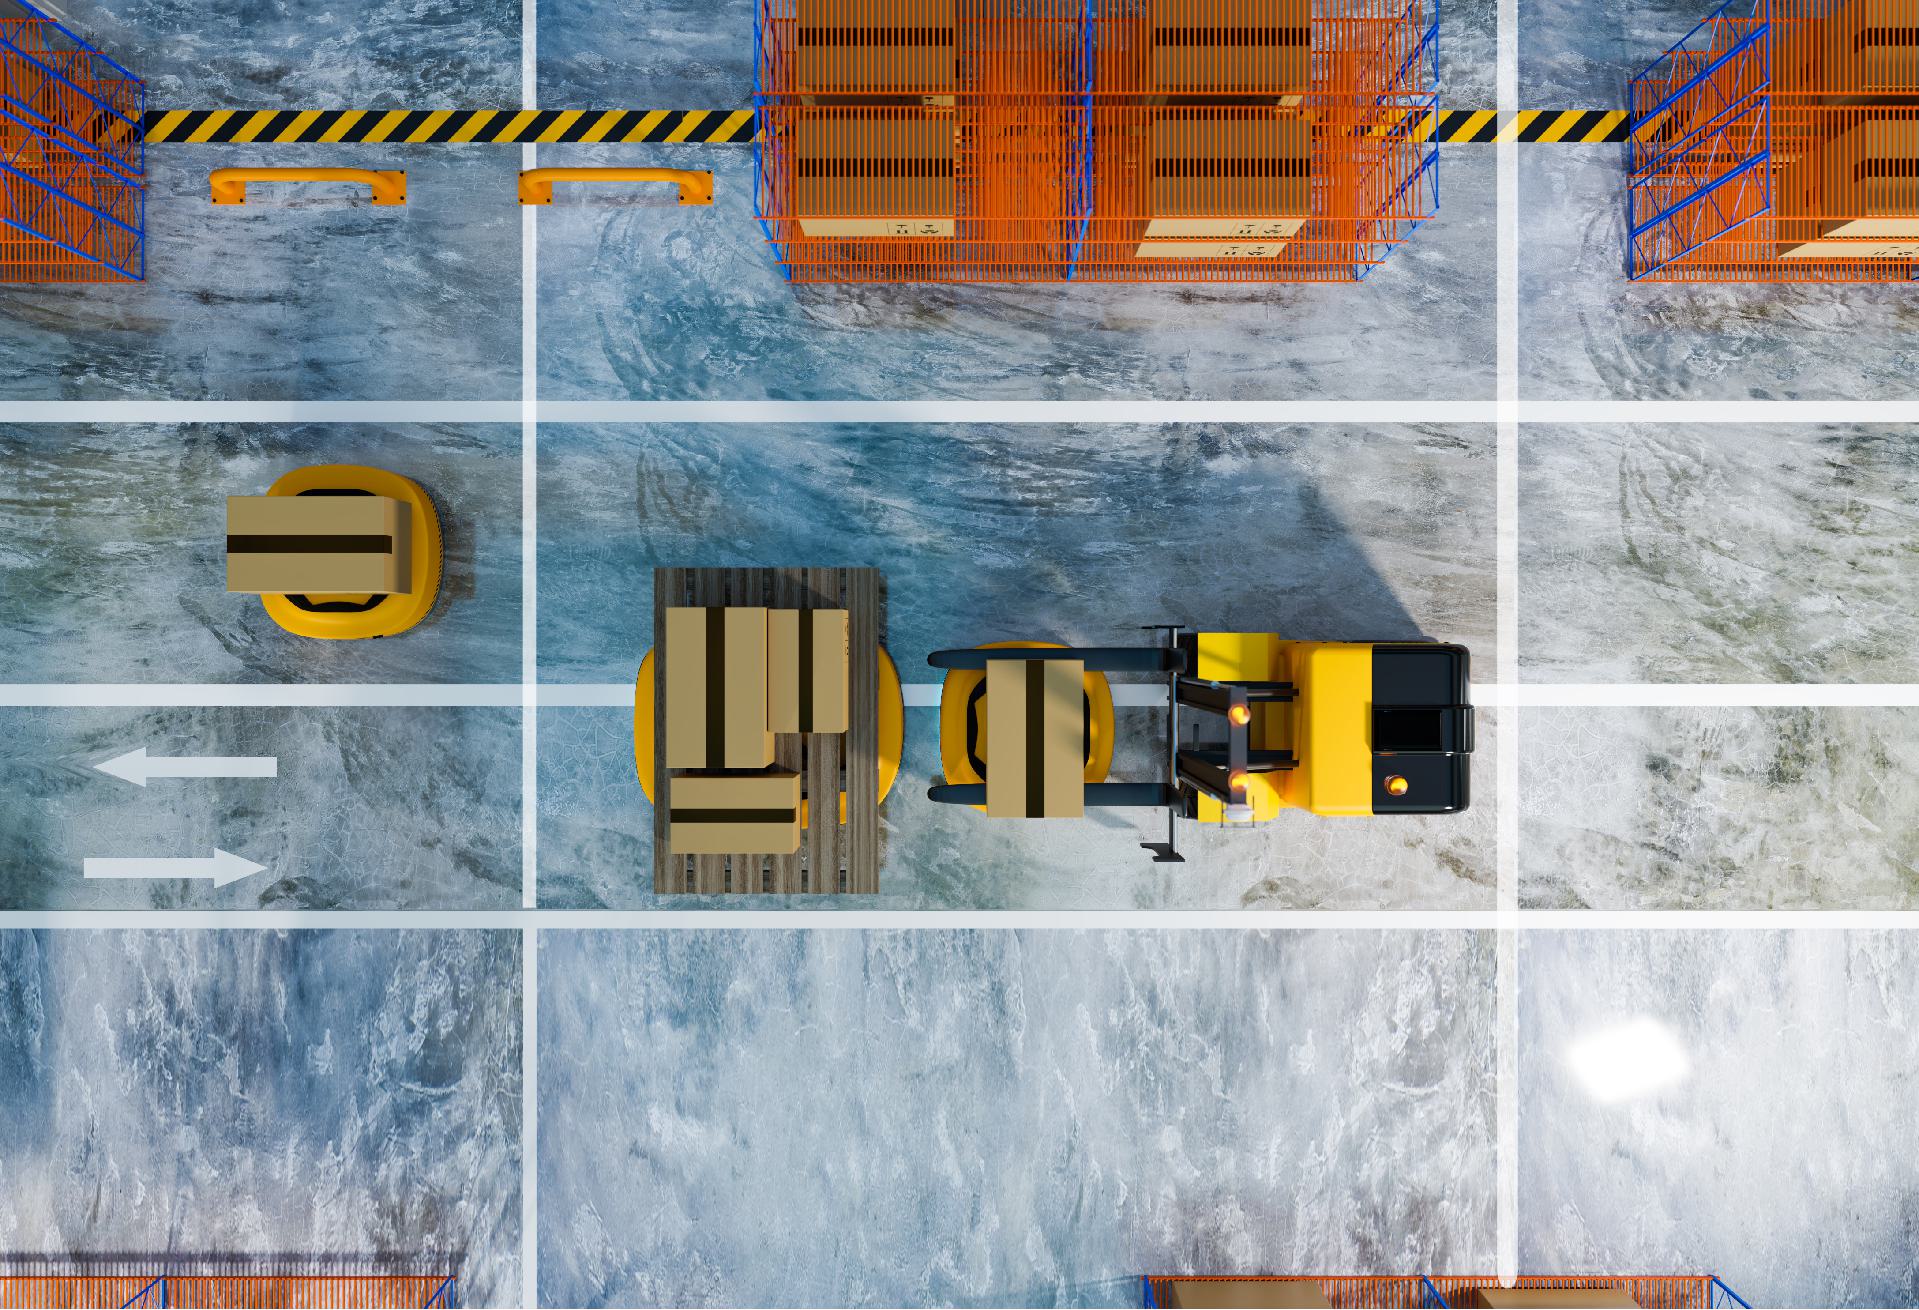
A freight operation generates data at every touch. A GPS ping, a job record, a delivery scan, a fuel transaction, a subcontractor invoice. The trouble is where it lands. The transport management system holds the job, the telematics platform holds the movement, the warehouse system holds the dock, and accounts holds the cost. Each sees one slice, and none of them agree on what a “job” or a “customer” is. So the questions that actually decide profit get answered with a margin assumption and a hunch. Is this contract making money once detention is counted. Why does this customer keep complaining about late deliveries. Are the trucks running as full as we think. The data to answer all three already exists in the business. Getting an end-to-end view out of it is the job.
Why a dashboard or a tool alone falls short
The common fix is to buy a reporting tool, point it at the systems, and wait for clarity. It rarely comes. The reason is the foundation, not the software. New supply chain management technology built on messy, unjoined data produces confident-looking nonsense. A lane shows as profitable because the dashboard counts revenue and ignores empty running back to the depot. On-time rates look fine because half the late scans never made it into the feed. This is principle #1, quality in, quality out, in its bluntest form for freight. A clever chart on bad data is more dangerous than no chart, because people act on it. The tool is not the problem. The unreconciled job, vehicle and cost data underneath it is.
How we deliver it for transport and logistics
We start by getting the data ecosystem healthy, principle #4, which here means reconciling your TMS, telematics and warehouse records into one job-and-vehicle view that survives a dispatcher’s scrutiny. We are realistic about mixed owned-fleet and subcontractor data. Carrier files arrive late, in odd formats, with gaps, so we document those limits and build analysis that accounts for them rather than pretending every leg is clean and complete.
From there we work in small batches, principle #7, improving one question at a time. We usually open on a single decision that moves the bottom line, lane profitability or one recurring on-time failure, validate the finding against your operational records and your schedulers’ knowledge, then extend into utilisation and capacity planning once you trust the first number. We write down and version the metric definitions and pipelines, so “cost-to-serve” and “active lane” mean the same thing in every report and the figures stop drifting between meetings. The principles behind this are set out in our approach.
When this is, and is not, the right call
This work fits when you run real freight volume across multiple lanes, hold data in two or more systems that do not talk, and make pricing or service decisions you cannot currently defend with numbers. It is the right call when the cost of one mispriced contract dwarfs the cost of getting the analysis right.
It is not the right call if you have a single van and a spreadsheet that already tells you everything. We will say so. We will also flag where an apparent efficiency would cut across work-and-rest limits or chain-of-responsibility duties under the Heavy Vehicle National Law, rather than recommending a schedule that looks tighter on paper but breaches fatigue rules. Where customer data is involved, we keep the handling consistent with the Privacy Act and Australian Privacy Principles, and we are careful about data residency for any cloud analytics.
Related services and sectors
This pairing sits alongside our wider work. See the parent Data Insights & Analysis service, the Transportation & Logistics industry page, and related delivery in AI Agents for automating the freight admin once the numbers are trusted.
Read more about our Data Insights & Analysis service and our work in Transportation & Logistics sector.
Representative solutions.


Frequently asked.
How can AI be used in logistics?
Is AI taking over the supply chain?
What are the 5 ways AI is becoming essential to supply chain?
How is AI impacting logistics?
Is AI replacing logistics workers?
Find the lane that is quietly losing money
Tell us one freight decision the current reporting cannot answer cleanly, a lane, a customer or a recurring late run. We will show you what your existing job and telematics data can already prove.
Book a discovery call